7. Analytics and reports
Numbers about your hiring, and reports you can download or schedule.
On this page:
- Analytics
- Quality of Hire: do your tests predict performance?
- Fairness: do groups of candidates meet the bar at similar rates?
- Candidate experience: completion and NPS
- Skill insights: how strong candidates and employees are
- Reports
Analytics
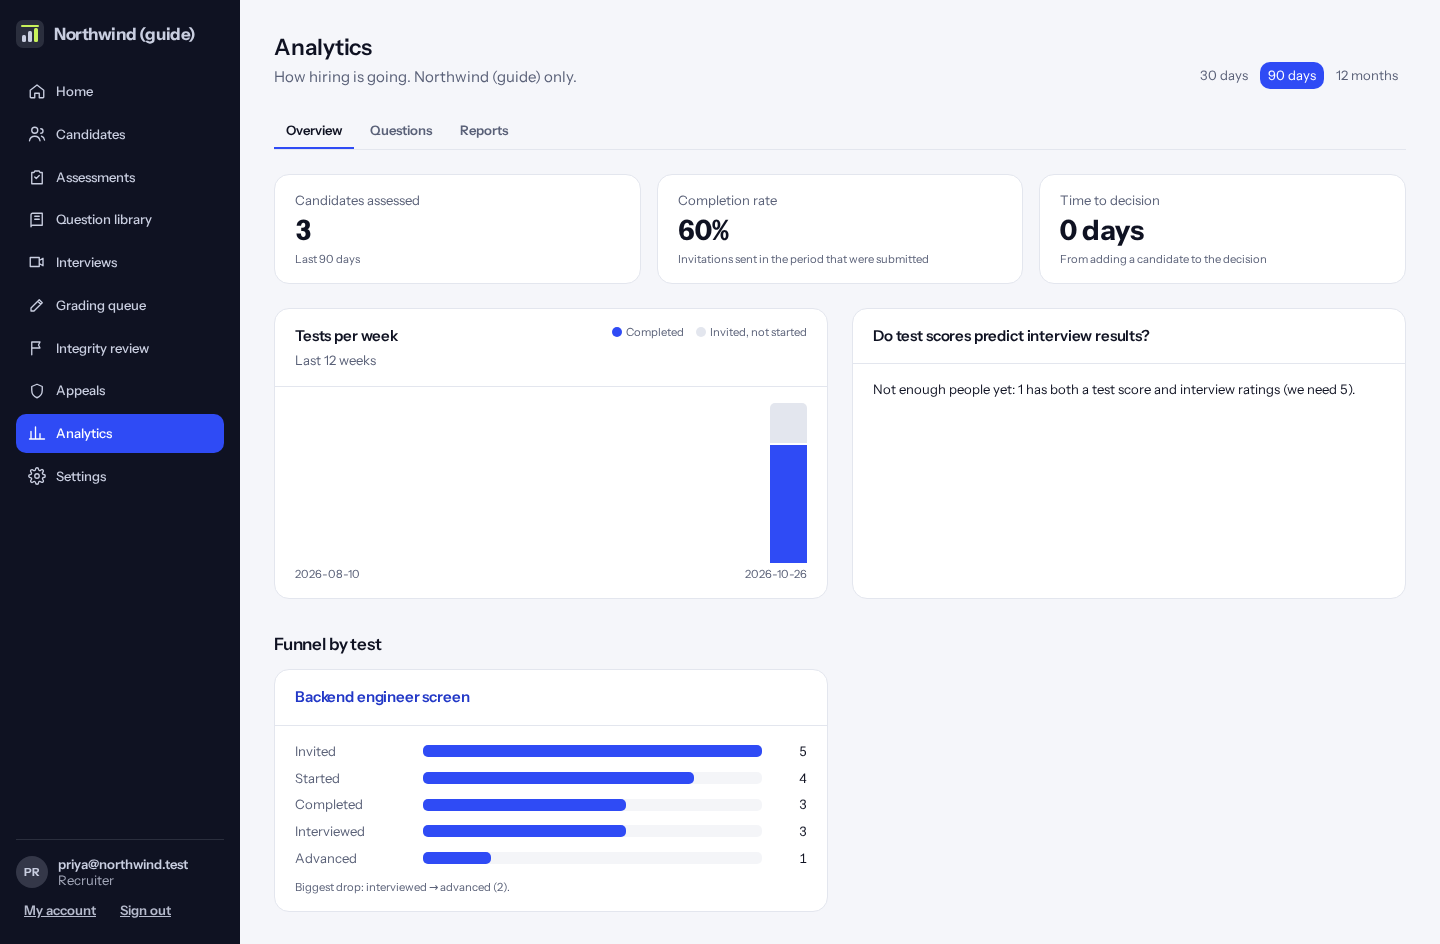
Click “Analytics”. See candidates assessed, completion rate, time to decision, tests per week, and the funnel for each test. “Interviewed” counts interviews that really started, not ones closed without being held. Choose the period at the top right.
Quality of Hire: do your tests predict performance?
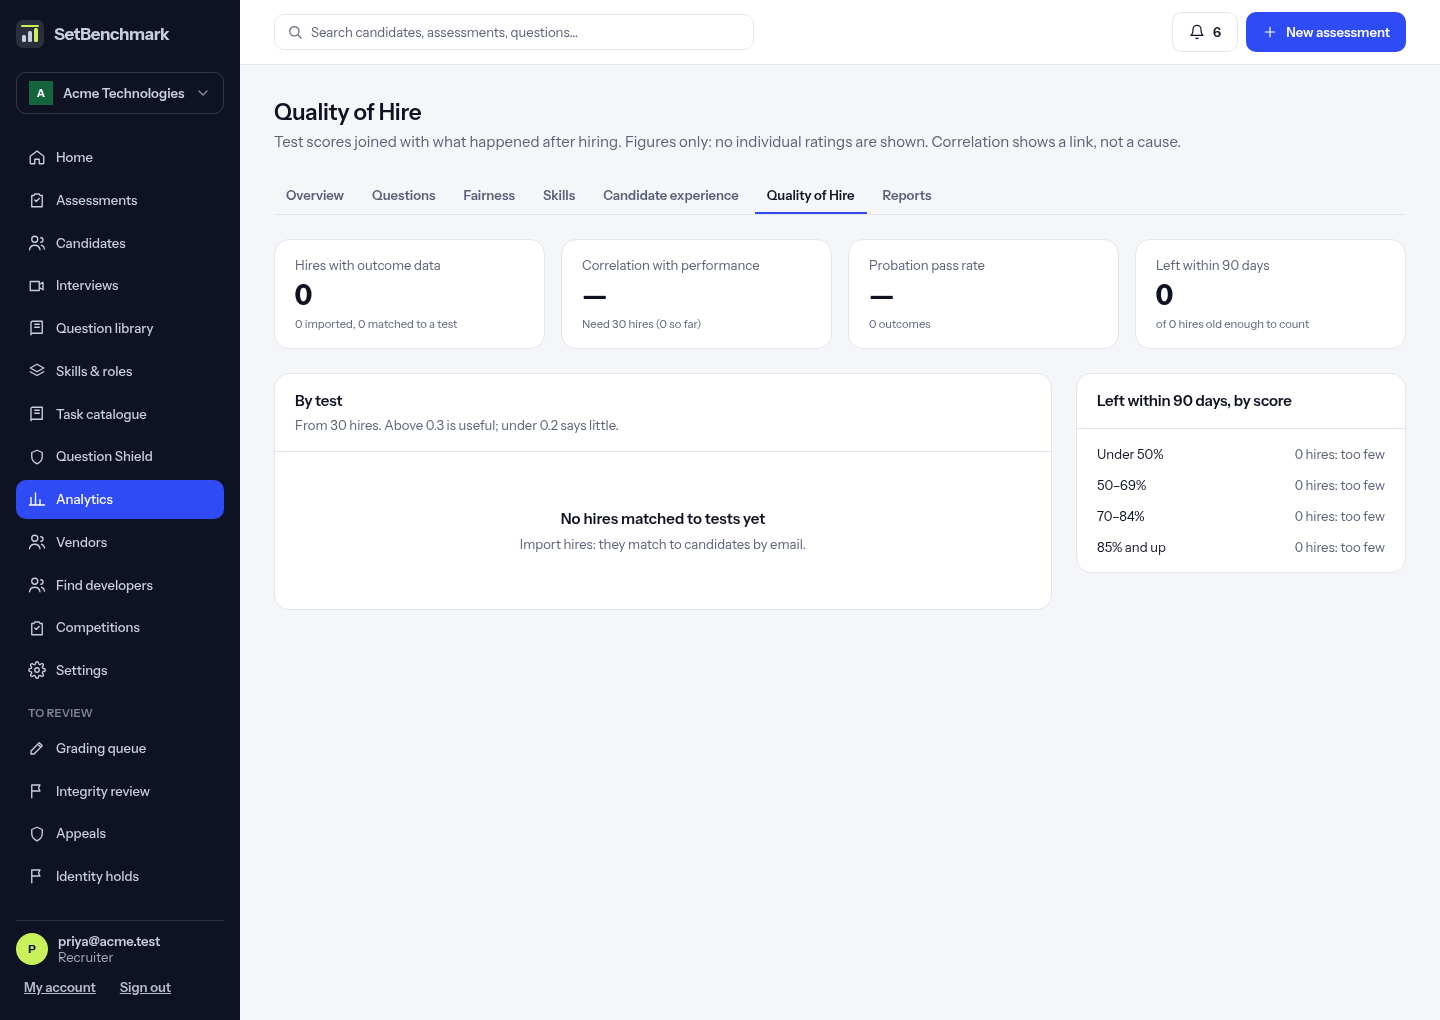
Click “Analytics”, then “Quality of Hire”. It joins test scores with what happened after hiring: correlation with performance ratings per test and per skill, who left within 90 days by score, and the probation pass rate. Only figures show, never one person’s rating. Tests invalidated in an integrity decision are left out.
Correlation appears from 30 hires, with its 95% range. Below that you’ll see “Need 30 hires (24 so far)”. Above 0.3 is useful; under 0.2 says little, and a suggestion to replace the test appears. It shows a link, not a cause.
Admins click “Import hires” and choose a CSV with employee_ref, email, role, manager, joined_at, exit_at, exit_reason, rating, rating_period, probation. People match to candidates by email. Importing again updates rows. Ratings are compared within each rating_period, so different scales are fine. HR systems can send the same data through the API.
Where skills differ, you may see suggested weights. “Approve as version” records them as a new scoring model for that test. Results handed in from then on show a “Weighted score (scoring model v2)” line under the score on the candidate’s page: each skill counted as approved. The score itself, the pass mark and rankings never change, and earlier results keep no weighted score.
A red alert means a test fell under the four-fifths line (0.80) in the fairness report. Admins are emailed at most monthly.
Fairness: do groups of candidates meet the bar at similar rates?
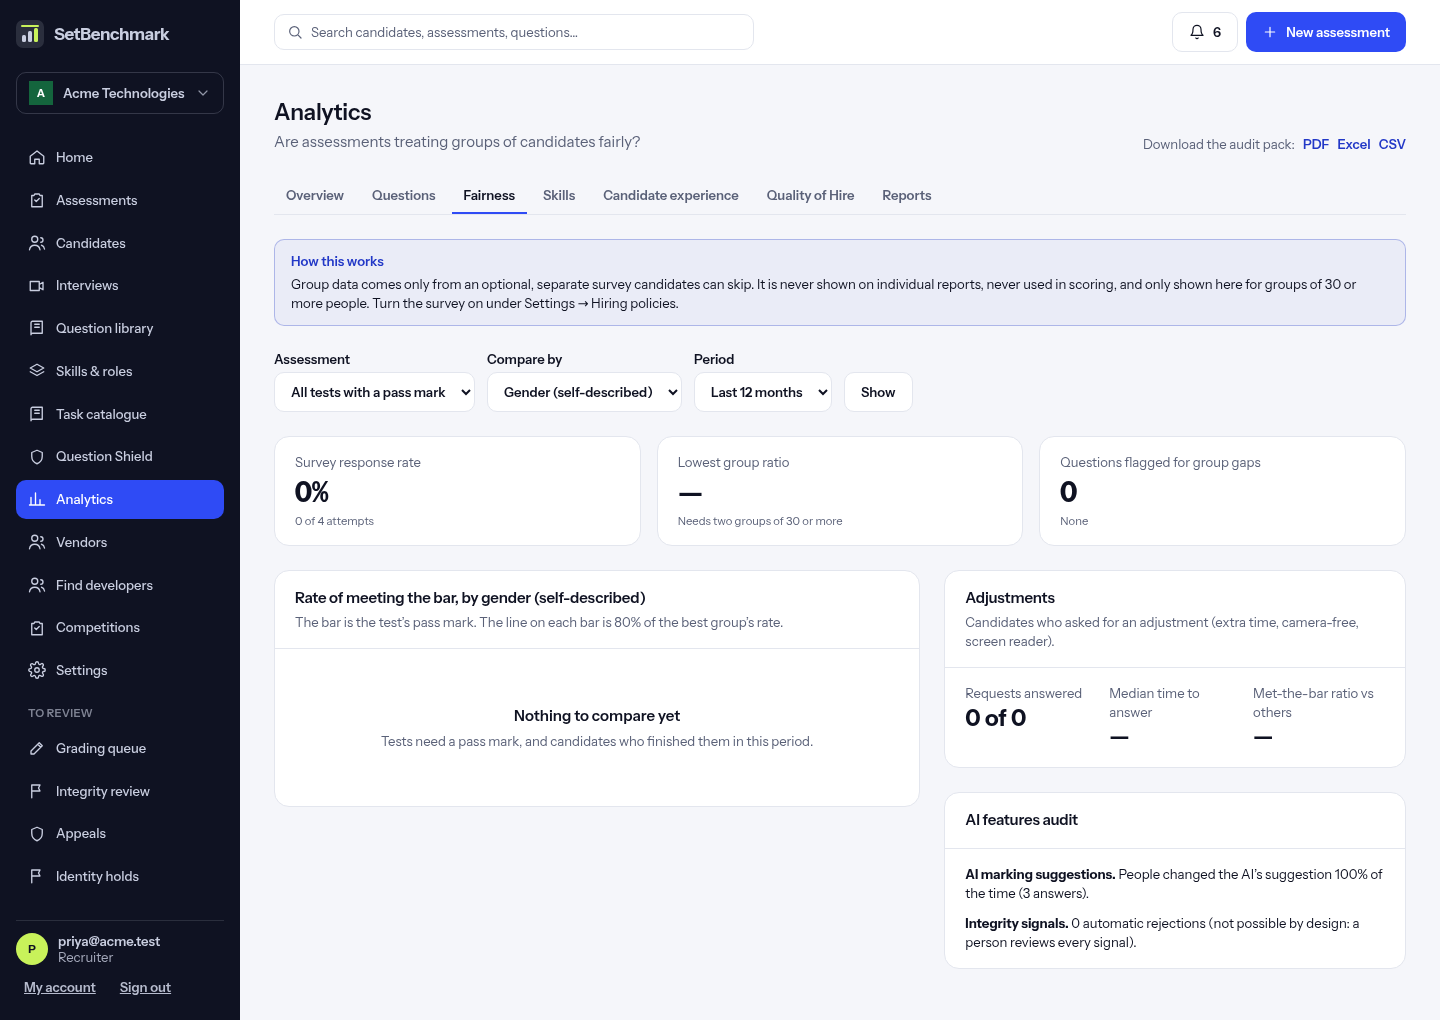
Click “Analytics”, then “Fairness”. It compares groups of candidates on how often they met the bar (the test’s pass mark), so only tests with a pass mark count. Choose the test (or all of them), what to compare by (gender, age band, region, or whether the test was taken with adjustments) and the period.
Group data comes only from the optional equality survey that candidates can skip (turn it on under Settings → Hiring policies). It is never shown on anyone’s report, never used in scoring or decisions, and groups under 30 people are hidden.
Each group shows how many met the bar, as a bar with a line at 80% of the best group’s rate, and the ratio to the best group. A ratio under 0.80 is flagged “look into it”. Questions where groups scored much further apart than on the test as a whole are listed, with links to their stats.
The page also shows adjustment requests (how many were answered and how fast, and whether people with adjustments met the bar as often), how often people changed the AI’s marking suggestions and whether that differs by group, and that no one is ever rejected automatically for integrity signals.
Download the audit pack as PDF, Excel or CSV for your records or an auditor.
Tip: A flag is a reason to look, not proof of unfairness. Check the question’s wording and timing with the people who wrote it.
Candidate experience: completion and NPS
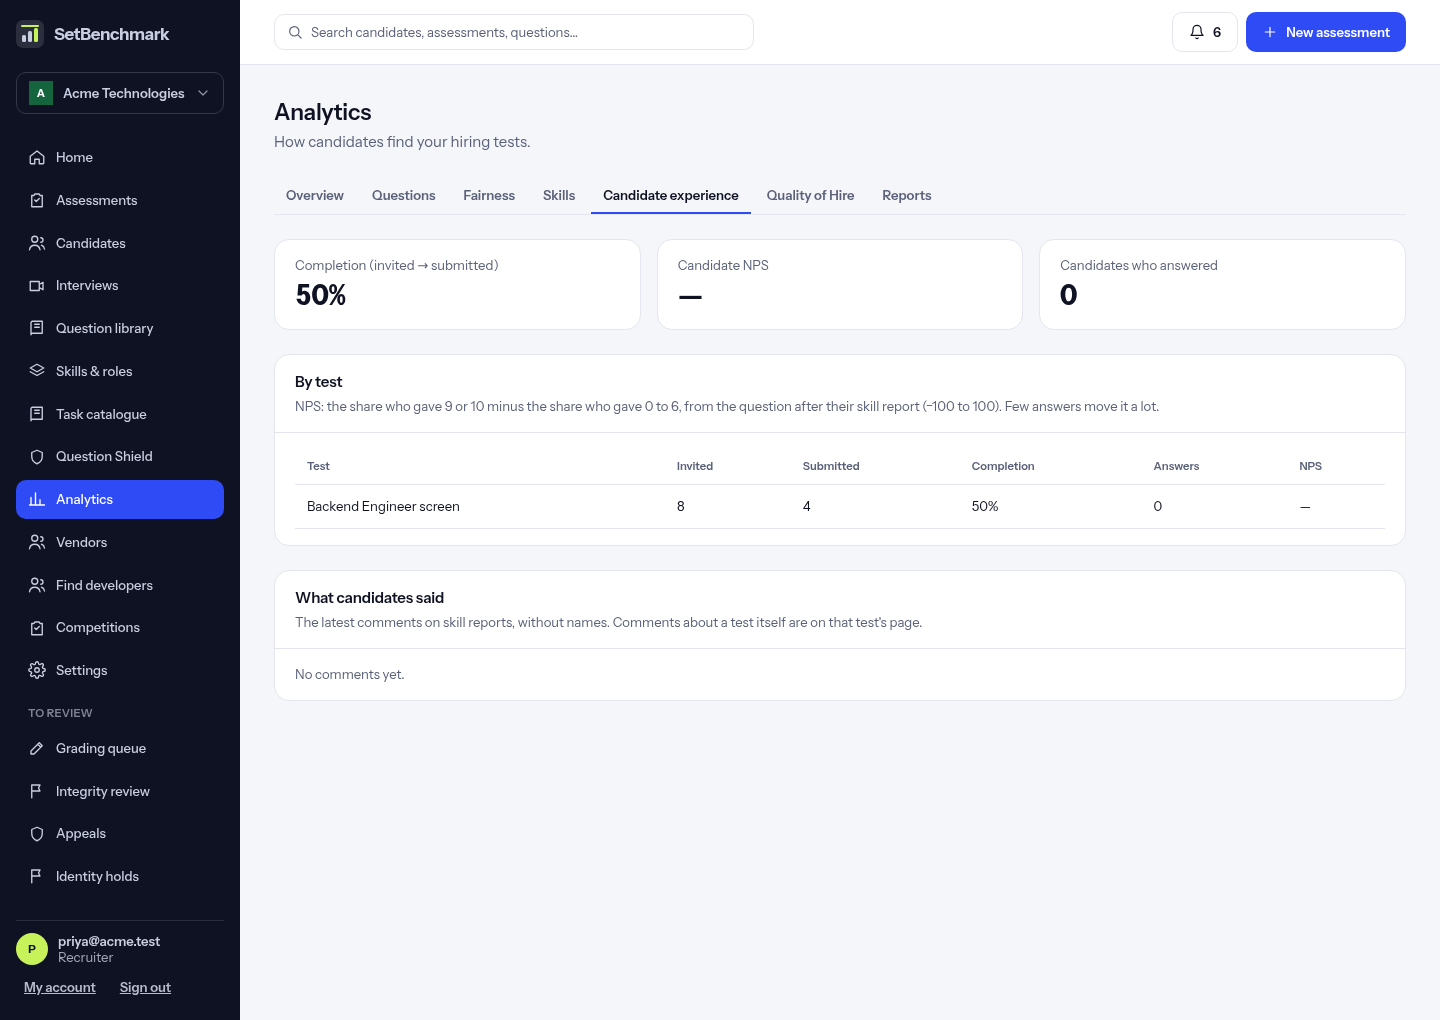
Click “Analytics”, then “Candidate experience”. For each hiring test you see how many candidates were invited, how many submitted, and the completion rate.
After reading their skill report, candidates are asked one question: “How likely are you to recommend this hiring process to a friend?” from 0 to 10, with an optional comment. The NPS is the share who gave 9 or 10 minus the share who gave 0 to 6, from −100 to 100. With few answers it moves a lot.
Below are the latest comments, without names.
Skill insights: how strong candidates and employees are
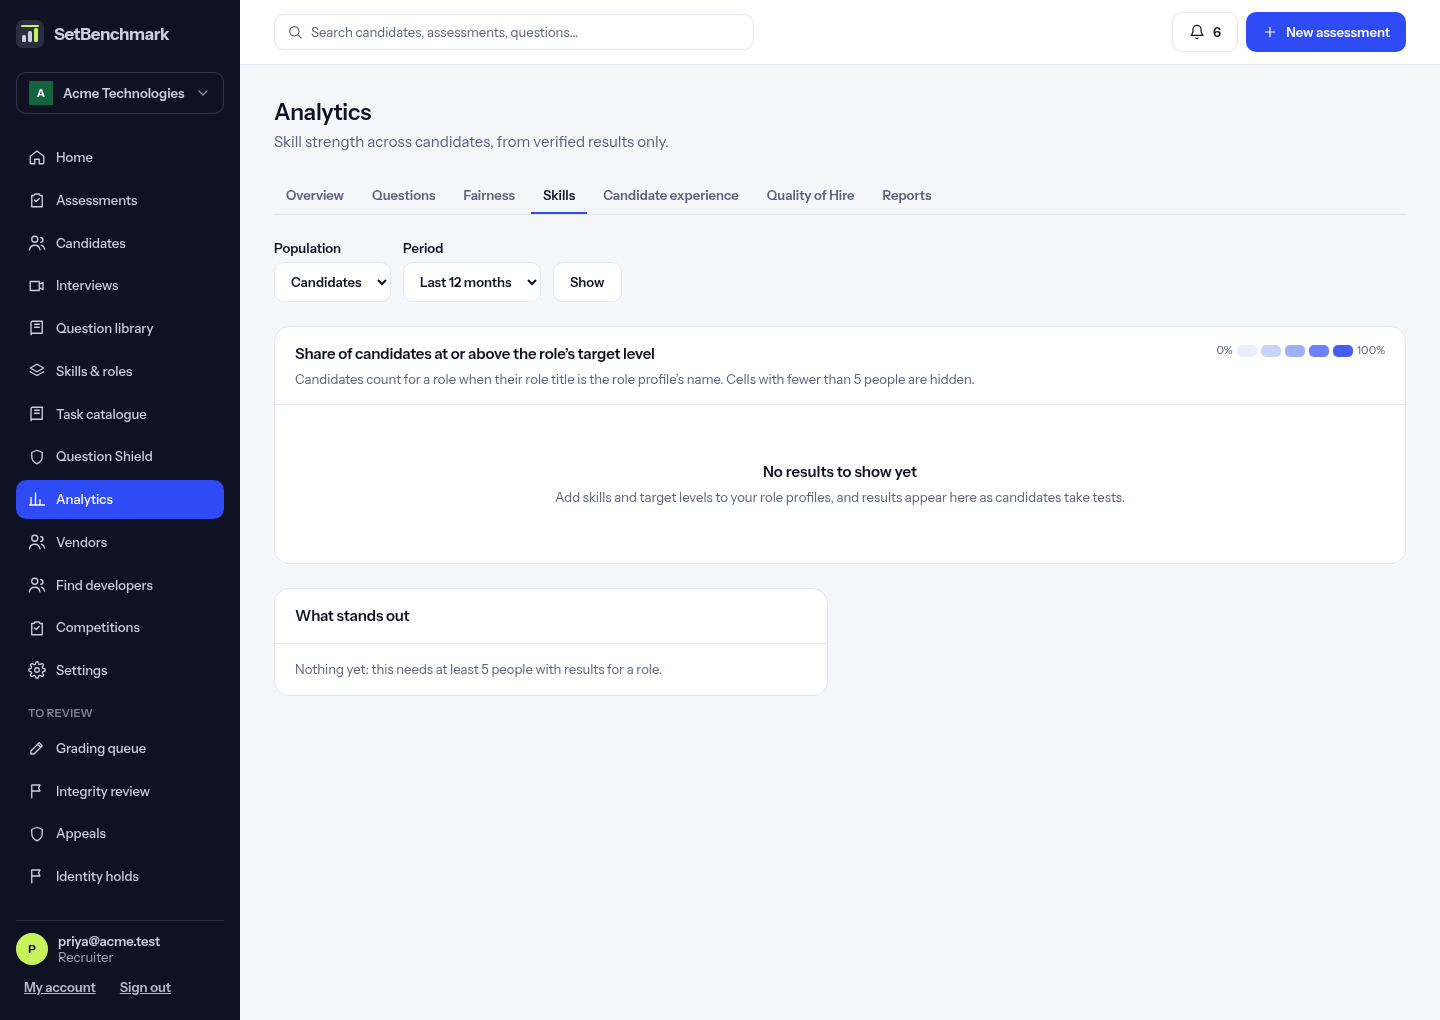
See which skills are weakest and strongest across all your candidates or employees. Click “Analytics”, then “Skills”. The grid shows, for each role profile (rows) and each skill it needs (columns), the share of people at or above the role’s target level. Darker means a larger share. Only verified test results count.
Candidates count for a role when their role title is the role profile’s name, so name roles the same way in both places. Choose “Employees” (HR) to measure every employee with results against each role. Cells with fewer than 5 people are hidden; “not tested” means the role needs the skill but no one has a result for it.
With working-with-AI scores, a “Working with AI” column shows the share scoring 15 of 20 or more.
“What stands out” names the hardest skill to clear for a role, the role strongest with AI tools, and a skill a role needs that isn’t tested, with a link to fix it. Click a cell to see how levels spread (1 Beginner to 5 Expert) for that role and skill, with the target marked. Like the cells, the spread only shows for 5 people or more.
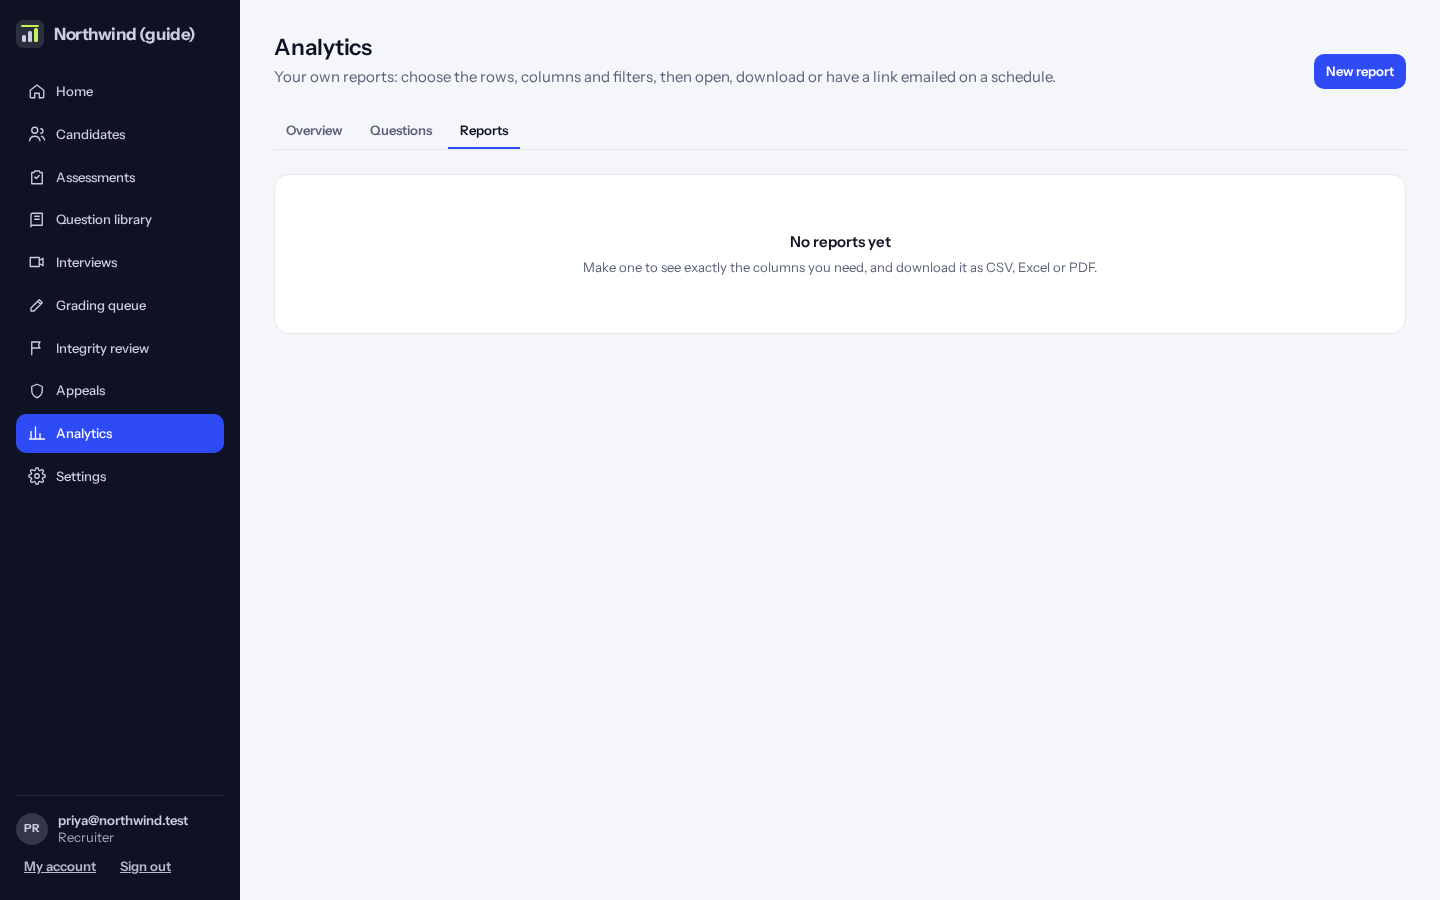
Reports
Under “Reports”, build your own report from the columns you need, download it as CSV, Excel or PDF, or have a link to it emailed on a schedule.